Part 1: Styling Data
Loading data
Loading data can occur in multiple ways. For this course, we will use the Browser and the Data Source Manager.
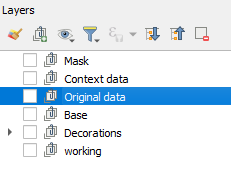
One of the important aspects to an efficient mapping product, is keeping it tidy. A way to do this is to create Groups in the Layers panel.
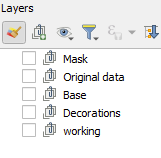
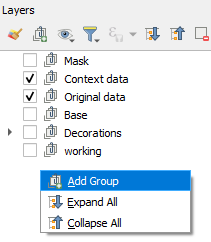
> - Create the above groups in the layers panel by right mouse clicking in the layer panel and selecting Add group.
> 
Browser
Accessing the data via the Browser panel, we will add the data to the groups. > - Ensure you have the Browser panel open.
> 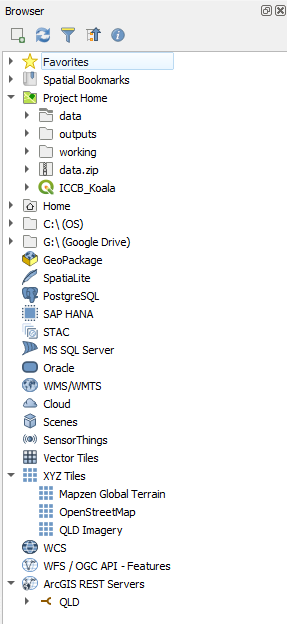
> - At the top of the Browser, click on the arrow next to Project Home to expand it
> 
> - Expand the Data folder
We are going to select multiple files and load them under the group headings > - First, in the Layers panel, click on the group ‘Original data’
> 
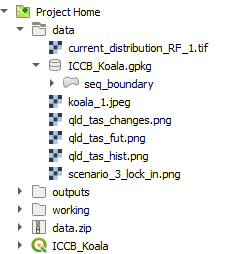
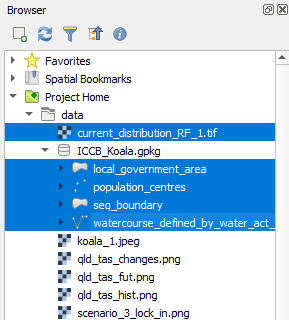
> - Then head over to the Browser panel and expand the data folder.
We want to select multiple files and load them into the ‘Original data’ group. We can do this by holding down the ctrl key whilst clicking on multiple the files. > - Hold down the ctrlkey, and click on the following files > - ‘current_distribution_RF_1.tif’
> - Expand the geopackage and click on all the layers*
> - With all of these selected, click on the Add selected layer button at the top of the Browser panel
> 
> - This results in layers nested under the ‘Original data’ group
> 
> - Turn off the layers, population_centres and watercourse
> - Save your project
N.B. The layers in the geopackage have been extracted from the ArcGIS REST Service from the Queensland Government. Refer to Ref A - Add Data for step by step instructions for other methods.
Nearly there with the data, we just need to add in a basemap.
> - In the Layers panel, click on the group ‘Base’
> - In the Browser, under XYZ Tiles, click on ‘Qld Imagery’
> - Click on the Add selected layer button at the top of the Browser panel
Next, we are going to add in the picture of the Koala. We are doing this as we want to be a little bit clever for some tricks later on. Usually we would just add the picture to the Print Layout. > - In the Layers panel, click on the group ‘Decorations’ > - In the Browser, under the ‘Data’ folder, click on koala_1.jpeg > - Click on the Add selected layer button at the top of the Browser panel > - Save your project
Styling
Now it is time to style the:
- Koala distribution: ‘current_distribution_RF_1.tif’
- LGA: local_government_area
- Mask: seq_boundary
Create a Palette
We all consume branding everyday and choosing a palette of colors is a part of it. Artists will also look to a set of colors, a palette, to help harmonise their work. So let’s create a palette from the Koala picture you have.
> - In the Layers panel, expand the ‘Decorations’ group
> - Right mouse click on the ’koala_1.jpeg’and click on Zoom to layers
> - On the top menu, click on Settings > Options' > - In theOptions, selectColorson the left side >  > - Click on the drop down where it says *Standard colors* and select *Project colors* > - Click on the green plus button to bring up theSelect colordialog >  > - Click on theSamplingtab > - To start collecting the colors for the palette click theSample colorbutton > - Let's start with a light grey first, so click the background of the koala image to pick up the grey and clickOK`
>  > - Save your project
The grey now appears in the palette. you can change the label it you want. Repeat the above to capture the following: - Browns from the trunk - Greens from the leaves - Greys from the fur and nose - Pinks from the fur > 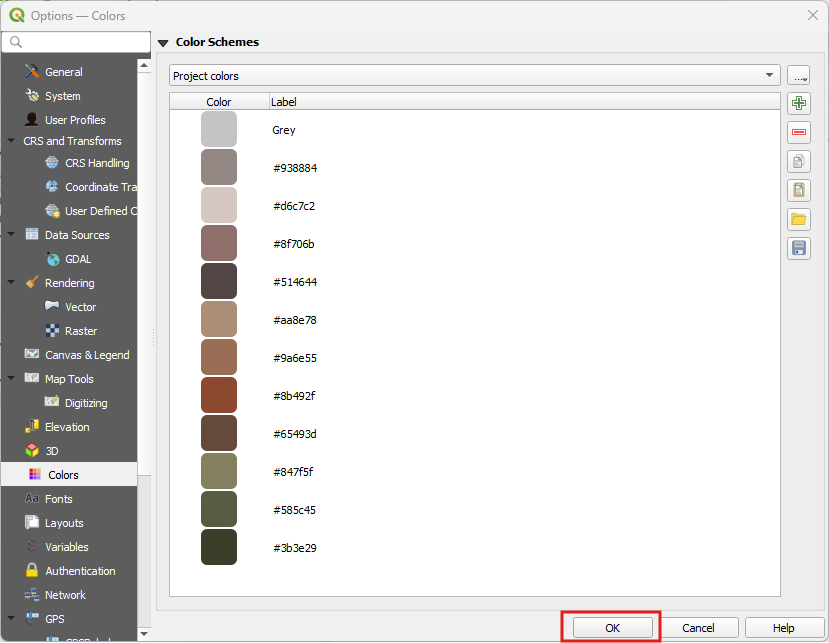
> - click OK
> - Save your project
These project colors are now built into this project file. They will appear when you go to the palette option to select colors.
AOI Map
First, we are going to create our “AOI” map - our area of interest. For this we will want the following datasets turned on:
- Mask: seq_boundary
- LGA: local_government_area
- Qld Imagery
Create the Mask
- Under ‘Original data’ turn on the layer seq_boundary and zoom to it (right mouse click)
- Right mouse click on it and select
Duplicate Layer
- Move this layer to the sit under the ‘Mask’ group
- Rename it to AOI (right mouse click >
Rename Layer) and click on it so it becomes theActivelayer
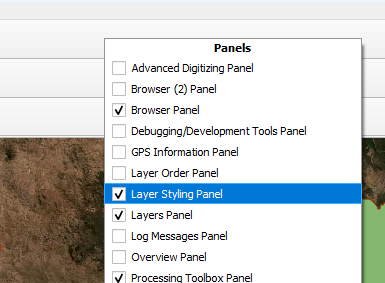
- Right mouse click anywhere in a blank area on the toolbar at the top and select
Panels > Layer Styling Panel
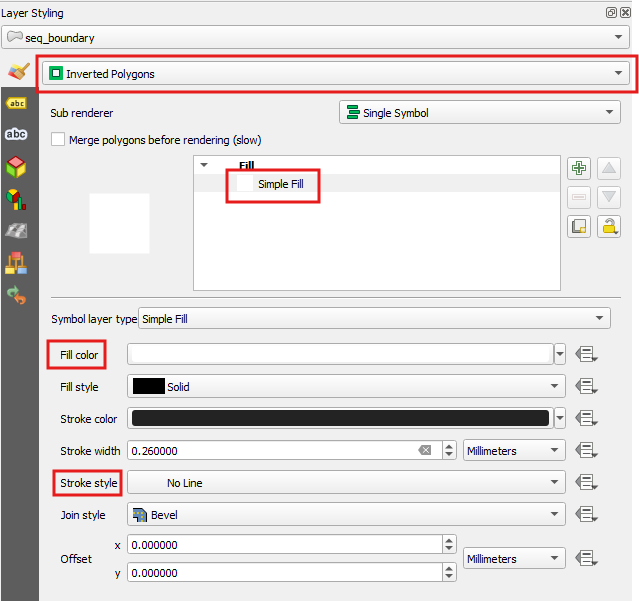
- In the
Layer Stylingpanel, select from the drop down `Inverted Polygons’
- Click on
Simple Filland remove the outline and change the colour to white
- Save your project
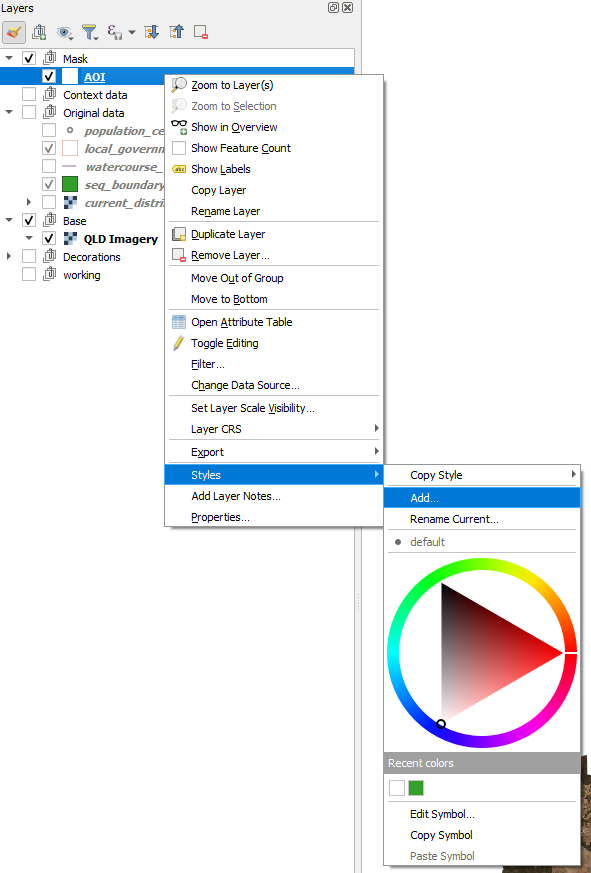
This is the mask we want for the ‘Island’ look for the Grid data, but for the AOI, we want to still see the surrounds so it helps us get our bearings. To do this, we are going to create an additional style for the AOI layer.
- Right mouse click on the AOI Layer and click
Styles > Add. Call this ‘AOI’
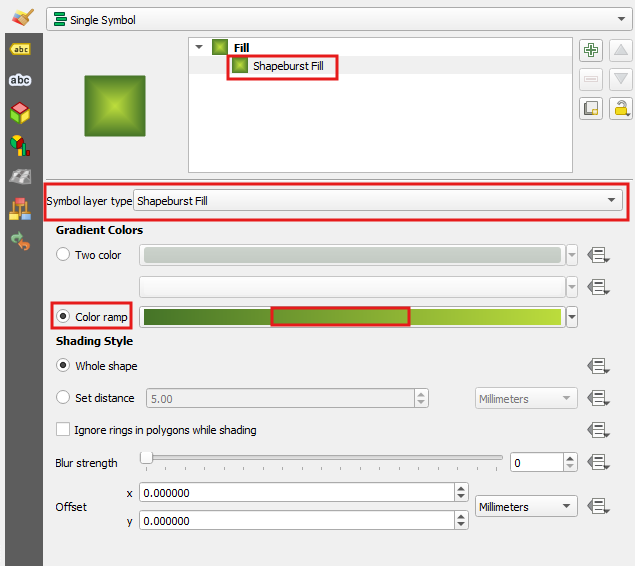
- In the Layers Styling panel, click on the Simple Fill and change it to
Shapeburst Fill
The Shapeburst Fill is a great effect and can also be used for styling water bodies. But we are going to create a transparent mask so we can still see the aerial image under it > - For the Gradient Colours select the Colour ramp option and click in the color bar to bring up our options.
> 
We are going to use the greens from our Project colors palette
> - For Color 1, select the darkest green you have
> - For Color 2, select white
> - Click ok > 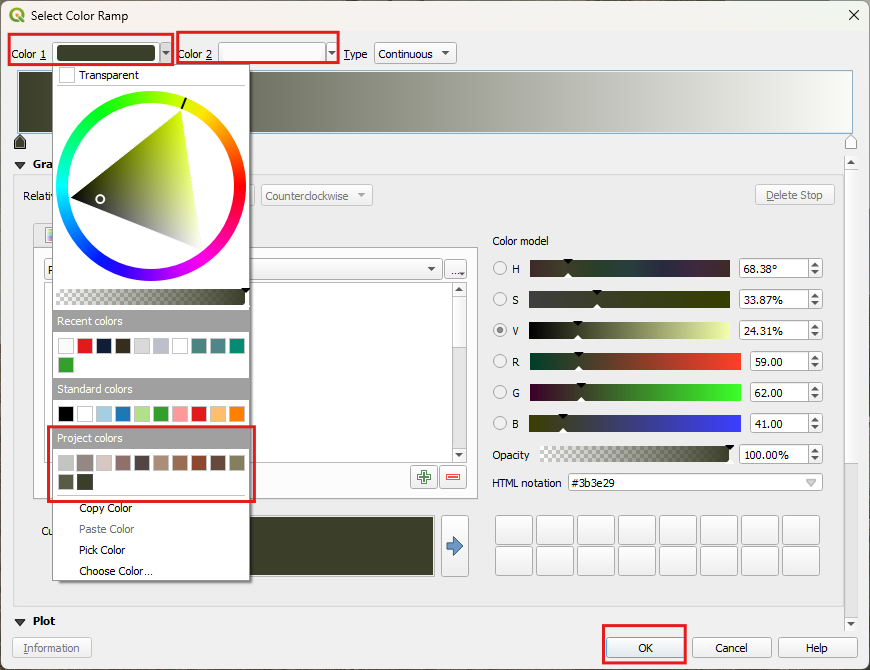
> - Save your project
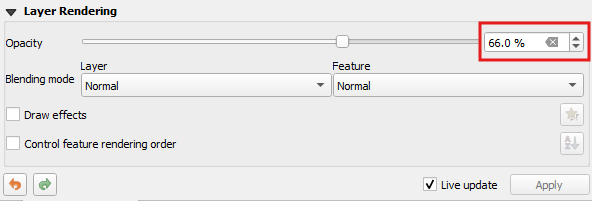
Last step for this AOI, we want to make it transparent.
> - In Layer Styling, at the bottom, expand the Lyaer Rendering options
> - Nect to Opacity click in the percentage field and make it 66%
> 
As you can see here, the QLD Imagery does not extend into the Coral Sea enough, so this is where we may have to replace it with another service. Ensure you have the rights to use it. An easy fix it to set the map property background colour to that of the sea. 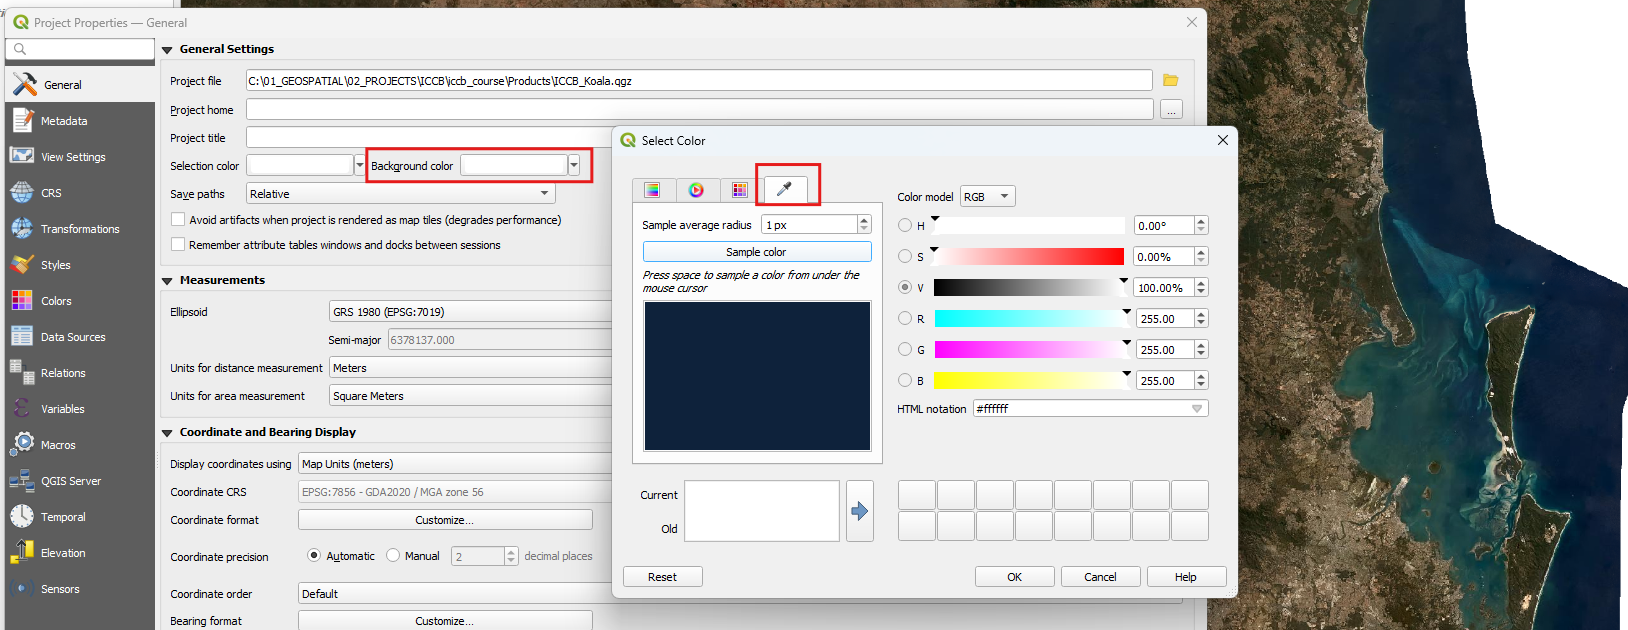
Let’s sort out our LGA’s now with boundaries and some labels.
Boundaries
> - Under ‘Original data’ duplicate ‘local_government_area’ and move the dupe into the ‘Context data’ group > - Rename it ‘LGA’ > - In the Layer Styling, click on Simple Fill and change the outline to a light grey (#d9d9d9)
Labels > - In the Layer Styling, click on the label tab
> 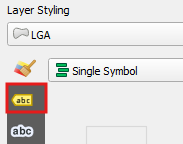
> - Select from the dropdown Single Labels
> - For the value, select ‘abbrev_name’
> - Select the font ‘Roboto Black’, size 6
> - For the color, select the same color as the outline - this should be on the palette
> - Click on the next tab and add in Multiple lines based on spacing
> - Add a Text Buffer of 0.7
> - Select a dark color form the Project colors palette